Usability:
Top States |
| 1.
Michigan |
Grade: A+ |
| 2.
Idaho |
Grade: A+ |
| 3.
Minnesota & Washington (tied) |
Grade: A |
Most
Improved States |
Since
2007 |
Since
2003 |
| 1. Arizona |
1.
Iowa &
Kansas (tied) |
| 2. Montana |
| 3. Connecticut |
3.
Arizona |
|
Over the five Grading State Disclosure assessments,
the Online Contextual and Technical Usability
category has proven to be the most difficult
area for states to earn an A, with just four
As received in 2008. However, this category
has seen tremendous improvement since Grading
State Disclosure 2003 when no state earned
an A and 27 states failed in this area. Due
to both higher performance on the study’s
usability test and enhancements to disclosure
web sites, 31 states earned higher grades in
this category than in 2007. Just five states
received an F in 2008 and twelve states that
failed in 2007 earned passing grades in 2008.
Fourteen states earned Bs, 13 earned Cs, and
14 earned grades in the D range.
- States
with the best contextual and technical
web site usability, in rank order from
one to ten, are: Michigan; Idaho; Minnesota
and Washington (tied for 3rd); Kansas
and Massachusetts (tied for 5th); California
and Iowa (tied for 7th); Arizona; and Virginia.
- States with the weakest contextual and
technical web site usability, in rank order
from 40 to 50, are: Mississippi, Oregon and
Vermont (tied for 40th); Montana; Alabama
and Georgia (tied for 44th); Nebraska; Delaware;
Wyoming; New Hampshire; and New Mexico.
Significant 2008 findings:
- 23 states offer online overviews of campaign
finance data, including comparisons of total
amounts raised and spent by candidates;
- 21 of these states offer overviews of both
the most recent and past legislative races;
20 post analyses of both statewide and legislative
campaigns;
- 2 states (Oregon and Vermont) offer campaign
finance analyses of past elections;
- 50 states post information about campaign
finance restrictions and disclosure requirements
online;
- 45
state disclosure web sites feature lists
of candidates for the most recent or current
election;
- 22
states provide comprehensive information
explaining which disclosure reports are available
online;
- 4 states provide little or no detail explaining
which disclosure reports are available online;
and
- 39 disclosure web sites are easily located
from their state homepage by either navigating
or searching the main state site.
Significant changes since 2007:
- 8 states improved their explanations of
which reports can be found on their disclosure
web sites;
- 9
states improved instructions for accessing
campaign finance data online;
- 6
states improved the terminology used on
their disclosure web sites (Alaska, Arizona,
California, Colorado, New Mexico, and Oklahoma);
- 2 states added or made improvements to
summary campaign finance information on their
web sites (Arizona and Hawaii); and
- 4
states expanded the scope of campaign finance
information available online to include
both original reports and clearly labeled
amendments (Arizona, Connecticut, Iowa, and
South Carolina).
Context and Usability of Disclosure
Web Sites
In
the Online Contextual and Technical Usability
category, state disclosure web sites are assessed
on the quality and quantity of contextual information
and instructions provided to the public in
order to use the disclosure site with confidence.
Explanations of state campaign
finance rules, regulations, and trends provide
a context for understanding campaign disclosure
data. Additionally, a clear description of
the data available on the site and simple,
straightforward instructions improve the public’s
ability to use campaign disclosure web sites
to find their desired data. To measure the
usability of a state’s disclosure web
site, the Campaign Disclosure Project
conducts a usability test to determine the
average site user’s ability to easily,
efficiently, and confidently extract specific
disclosure data from the web.
Explanation of the Data Available
Online
Most
state disclosure agencies provide a brief
description of the scope and availability of
disclosure data on their web sites. Forty-six
states offer at least a minimal amount of
information as to the scope of data online
and 22 of these states’ disclosure
sites offer thorough descriptions of the
data available, including the offices for
which candidate data is accessible, the time
period covered by the data, and which types
of disclosure reports can be viewed on the
site. Since the 2007 assessment, eight
states added information to improve the public’s
ability to determine the scope of the data
available, including Arkansas, Arizona, and
Tennessee that did so as part of overall enhancements
to their web sites.
Instructions for Site Users
Clear
instructions for researching campaign data
online are an important factor in determining
how user-friendly a disclosure site is, particularly
for new visitors. As noted above, most states
offer online, searchable databases that allow
users to collect specific campaign finance
data, though not all sites offer instructions
for operating these complex interfaces. Instructions,
tips, and hints throughout the disclosure site
are to key to ensuring that all users (from
novice to advanced) can access campaign finance
information online with confidence. Twenty-five
of the state disclosure sites feature thorough
instructions for users. Among the 24 remaining
sites that feature campaign finance data, 20
offer at least some instruction to the public
while four sites lack any real guidance for
users.
Usability Testing
2008
Usability Test Top
Performing States |
- Idaho
- Maine
- Michigan
- Minnesota
- Utah
- Virginia
- Washington
|
|
The
largest factor in a state’s grade
in the Online Contextual and Technical Usability
category is the study’s usability test,
which accounts for over one-third of the total
points in the category. The test measures the
public’s ability to locate a disclosure
web site from a state’s homepage and
extract accurate answers to specific questions
about candidate campaign finance activity (see
appendices for the complete test methodology).
There was a significant improvement in the
test results overall in 2008 as far more testers
were able to successfully navigate from the
state homepage to the disclosure site in order
to attempt the remaining tasks. That first
step proved key as all of the tests were completed
more quickly in 2008 and 32 states performed
better than in 2007. Despite more efficient
testing in 2008, just 34 percent of testers
rated their experiences on a disclosure site
favorably while 40 percent were rated poorly
and 26 percent were average.
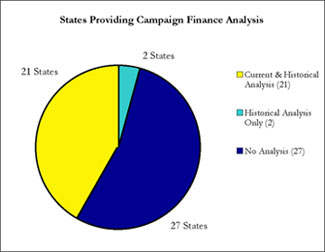
Campaign Finance Analysis
Twenty-three
state disclosure web sites provide information
to help the public understand how a candidate’s campaign finances compare
to overall state trends. On these disclosure
sites, the public can better understand the
role of money in state politics by reviewing
one candidate’s financial activity compared
to that of other candidates, or the totals
raised and spent in one election relative to
past campaigns. Twenty-one states provide both
current and historical data online, 20 of which
offer both statewide and legislative candidate
comparisons. While a few states have removed
archived comparison information from their
web sites since the 2007 assessment, two states
(Oregon and Vermont) have preserved such historical
data through 2004. Hawaii added an overview
of 2006 elections and Arizona debuted a new
campaign comparison tool on its disclosure
site in 2008.
click
image to enlarge
Amended Reports
Posting
all of a candidate’s disclosure
reports online, including those that have been
amended, is an important part of providing
the public with a complete view of the candidate’s
filing history. The public can view both original
and amended campaign filings on 36 state disclosure
web sites, including Arizona, Connecticut,
Iowa, Montana, and South Carolina, all of which
added this feature since the last assessment.
Thirty-six states retain both original and
amended reports, 34 of which clearly label
amendments as such, including Iowa, Montana,
and South Carolina, which all improved in this
area in 2008. By comparison, Grading State
Disclosure 2003 noted that just 23 states
posted both originals and clearly-labeled amendments.
Of the 14 states that do not retain original
filings when amendments are posted online,
six states (California, Maine, North Dakota,
Oregon, Pennsylvania, and Tennessee) clearly
identify reports that have been amended.
Site Redesigns
To
meet the rising expectations of the public,
and to take advantage of new web tools, disclosure
agencies continue to improve and redesign their
web sites. Grading State Disclosure 2007 found
that over one-third of states had redesigned
or restructured their disclosure sites since
the 2005 assessment. Since the 2007 assessment,
14 states (Alabama, Florida, Illinois, Kansas,
Kentucky, Massachusetts, Montana, New Jersey,
New Mexico, New York, North Carolina, Ohio,
Oklahoma, and Wyoming) have redesigned their
disclosure sites and Utah is scheduled to complete
a redesign in 2008. Twelve other states also
enhanced the navigability of their disclosure
sites or added new features to make data easier
to access. While a complete overhaul of a disclosure
web site is often not posssible due to financial
and/or technological limitations, even
minor improvements to terminology or navigation
tools, such as the graphic icons that debuted
on the redesigned disclosure sites of Illinois,
Kansas, and North Carolina, can go a long way
to making a site more user-friendly for the
public.
|