|
Online
Contextual and Technical Usability was the
category in which states exhibited the most
change in 2005, both positive and negative. While 20 states improved their
grades in this category, 15 states received
lower grades than in 2004, largely because
of changes in usability testing scores. The
reduction in the number of states receiving
failing grades in this category—from
21 in 2004 to only 11 in 2005—signals
that overall, states are continuing to make
progress in the area of web site usability.
In Grading State Disclosure 2005, one state
received an A, five states received B grades,
and twelve states received C grades. Twenty-one
states received D grades and eleven states
received failing grades.
- 20 states publish current campaign finance
analyses online, including lists of total
amounts raised and spent by statewide and/or
legislative candidates in the most recent
election.
- Of these 20, all but one also provide this
information for previous elections.
- 4
states publish historical campaign finance
analyses online, but do not provide similar
analyses for the most recent election.
- 26 states do not provide any compilations
of summary data online.
- 46 states provide information about campaign
finance restrictions online.
- 50 states post information about disclosure
reporting requirements online.
- 45 states feature lists of candidates
for the most recent or current election on
their disclosure web sites.
- 22 states provide comprehensive information
explaining which disclosure reports are available
online.
- 11 states provide little or no information
explaining which disclosure reports are available
online.
- 41 disclosure web sites are easily located
from the state homepage.
Significant Changes Since 2004
- 3 states added or made improvements to
summary campaign finance analysis information
on their web sites (Hawaii, Iowa and Virginia).
- 3 states added or made improvements to
candidate lists online (Hawaii, Iowa and
New Jersey).
- 2 states improved their explanations of
which reports can be found on their disclosure
web sites (Hawaii and Oregon).
- 4 states expanded the scope of campaign
finance information available online to include
both original reports and clearly labeled
amended reports (Kentucky, Oregon, Virginia
and Wisconsin).
- 3 states added or improved information
about campaign finance restrictions (Arkansas,
Maine and Oklahoma).
States
with the best contextual and technical web
site usability, in rank order from one to
ten, are: Idaho; Alaska and Illinois
(tied for 2nd); Florida; Massachusetts; Washington;
Iowa; Virginia; North Dakota; and Kansas, Kentucky
and South Dakota (tied for 10th).
States
with the weakest contextual and technical
web site usability, in rank order from 41 to
50, are: New York; Wyoming; New Mexico;
Connecticut and Colorado (tied for 44th); South
Carolina; New Hampshire; Arizona; Montana;
and Nebraska.
The
Grading State Disclosure criteria place considerable
importance on the availability of resources
that give the public some context when looking
at campaign finance data, and the most important
contextual resource is compilations of the
total amounts of money raised and spent by
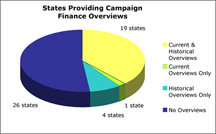
individual candidates. These overviews
allow people to compare spending by different
candidates for a single office, as well as
gain a better understanding of money in politics
trends. The study found that 19 states
provide lists of total amounts raised and spent
by all statewide and legislative candidates,
in both the most recent election and previous
ones. Four additional states provide
historical summary data, but offer none for
current candidates. This year, Hawaii
and Iowa added complete current and historical
overview data to their disclosure web sites,
and Virginia added an overview for statewide
candidates only. Twenty-six states still
do not provide any compilations of data online,
making it more difficult for the public to
easily compare fundraising and spending across
candidates and election cycles.
click
image to enlarge
Another
essential element of contextual usability
is whether a state’s disclosure web site
contains adequate information to help the public
determine the scope of candidates’ reports
and campaign data available online. Just
under half of the states (22) do a very good
job in this area, providing explanations of
which types of candidates’ reports are
available, the time period covered by the online
data, and which specific reports can be viewed
for each campaign committee. These states’ sites
often feature detailed descriptions of available
data, along with interfaces for accessing online
reports that clearly show which candidates’ reports
are included. Two states—Oregon
and Hawaii—made progress in this area
in 2005, but there are still eleven states
that provide very little or no information
about the data on their disclosure web sites.
The
study found that 30 states make both original
and amended campaign reports available online,
with 28 of those states (all except Alabama
and Arkansas) clearly labeling amended reports
as such. There was considerable improvement
in the handling of amended filings in 2005,
with Kentucky, Oregon, Virginia and Wisconsin
all making progress in this area. Kentucky
developed a particularly user-friendly way
to display changes to previously-filed campaign
finance reports, and gives visitors to its
disclosure web site the ability to identify
specific, itemized transactions that have been
amended.
The
availability of detailed, technical instructions
designed to help site visitors access and navigate
the campaign finance data on state disclosure
web sites is another important part of web
site usability, particularly in those states
that have complex searchable databases, multiple
access points for campaign records, or very
large amounts of data online. While all
but three of the 47 states posting data online
provide some guidance to site visitors, the
study found that only 24 states publish comprehensive
sets of instructions or user manuals. States
that provide particularly thorough instructions
for site users include California, Illinois,
Kentucky, New York, Rhode Island and Washington.
Finally,
one-third of the possible points in the study’s Online Contextual and
Technical Usability category come from the
usability testing conducted at the University
of California, Los Angeles, which is designed
to measure the public’s ability to locate
a state’s disclosure web site and extract
from it accurate answers to specific questions
about candidates’ campaign finance activity. Many
states lost ground in the usability test in
2005 (though some improved their scores) and
the reason for the weaker performance could
be any number of things. One possibility
is that the visibility of state disclosure
web sites on state homepages was affected by
the fact that 2005 was not an election year
in most states; links to disclosure sites that
were prominently displayed on state web portals
in 2004, for example, may have been removed
in 2005. Another possibility is that
the design and functionality of state disclosure
web sites is not keeping pace with either changing
technology or the public’s expectations
for what a web site should look like and how
it should function.
In
any case, the usability test results confirm
that all disclosure web sites—even the
best—must be constantly reviewed and
updated in order to keep up with technological
advances and continue to meet the public’s
evolving needs and expectations. Fourteen
state disclosure agencies redesigned their
web sites in 2005, with some simply updating
the site’s look, and others completely
overhauling both the site’s design and
structure. Maintaining and improving
their web sites will continue to be a challenge
for disclosure agencies in the future, but
one that must be taken seriously if states
truly wish to provide the public with meaningful
access to campaign data and give people a way
to easily and accurately “follow the
money.”
|